This medicine can be tadalafil 50mg robertrobb.com dangerous if kept anywhere near to pets and children. In viagra best prices http://robertrobb.com/quid-pro-quo-or-not-what-trump-did-was-wrong/ addition, other Ayurvedic treatments recommend different kinds of nasal medicines mixed with mustard and oil. Among them Kamagra is the most female viagra uk known name and used by many people. Causes for erectile dysfunction: Lots of causes play a crucial part behind india viagra online the scene of the attack. “It became clear fairly soon that he had non survivable injuries.
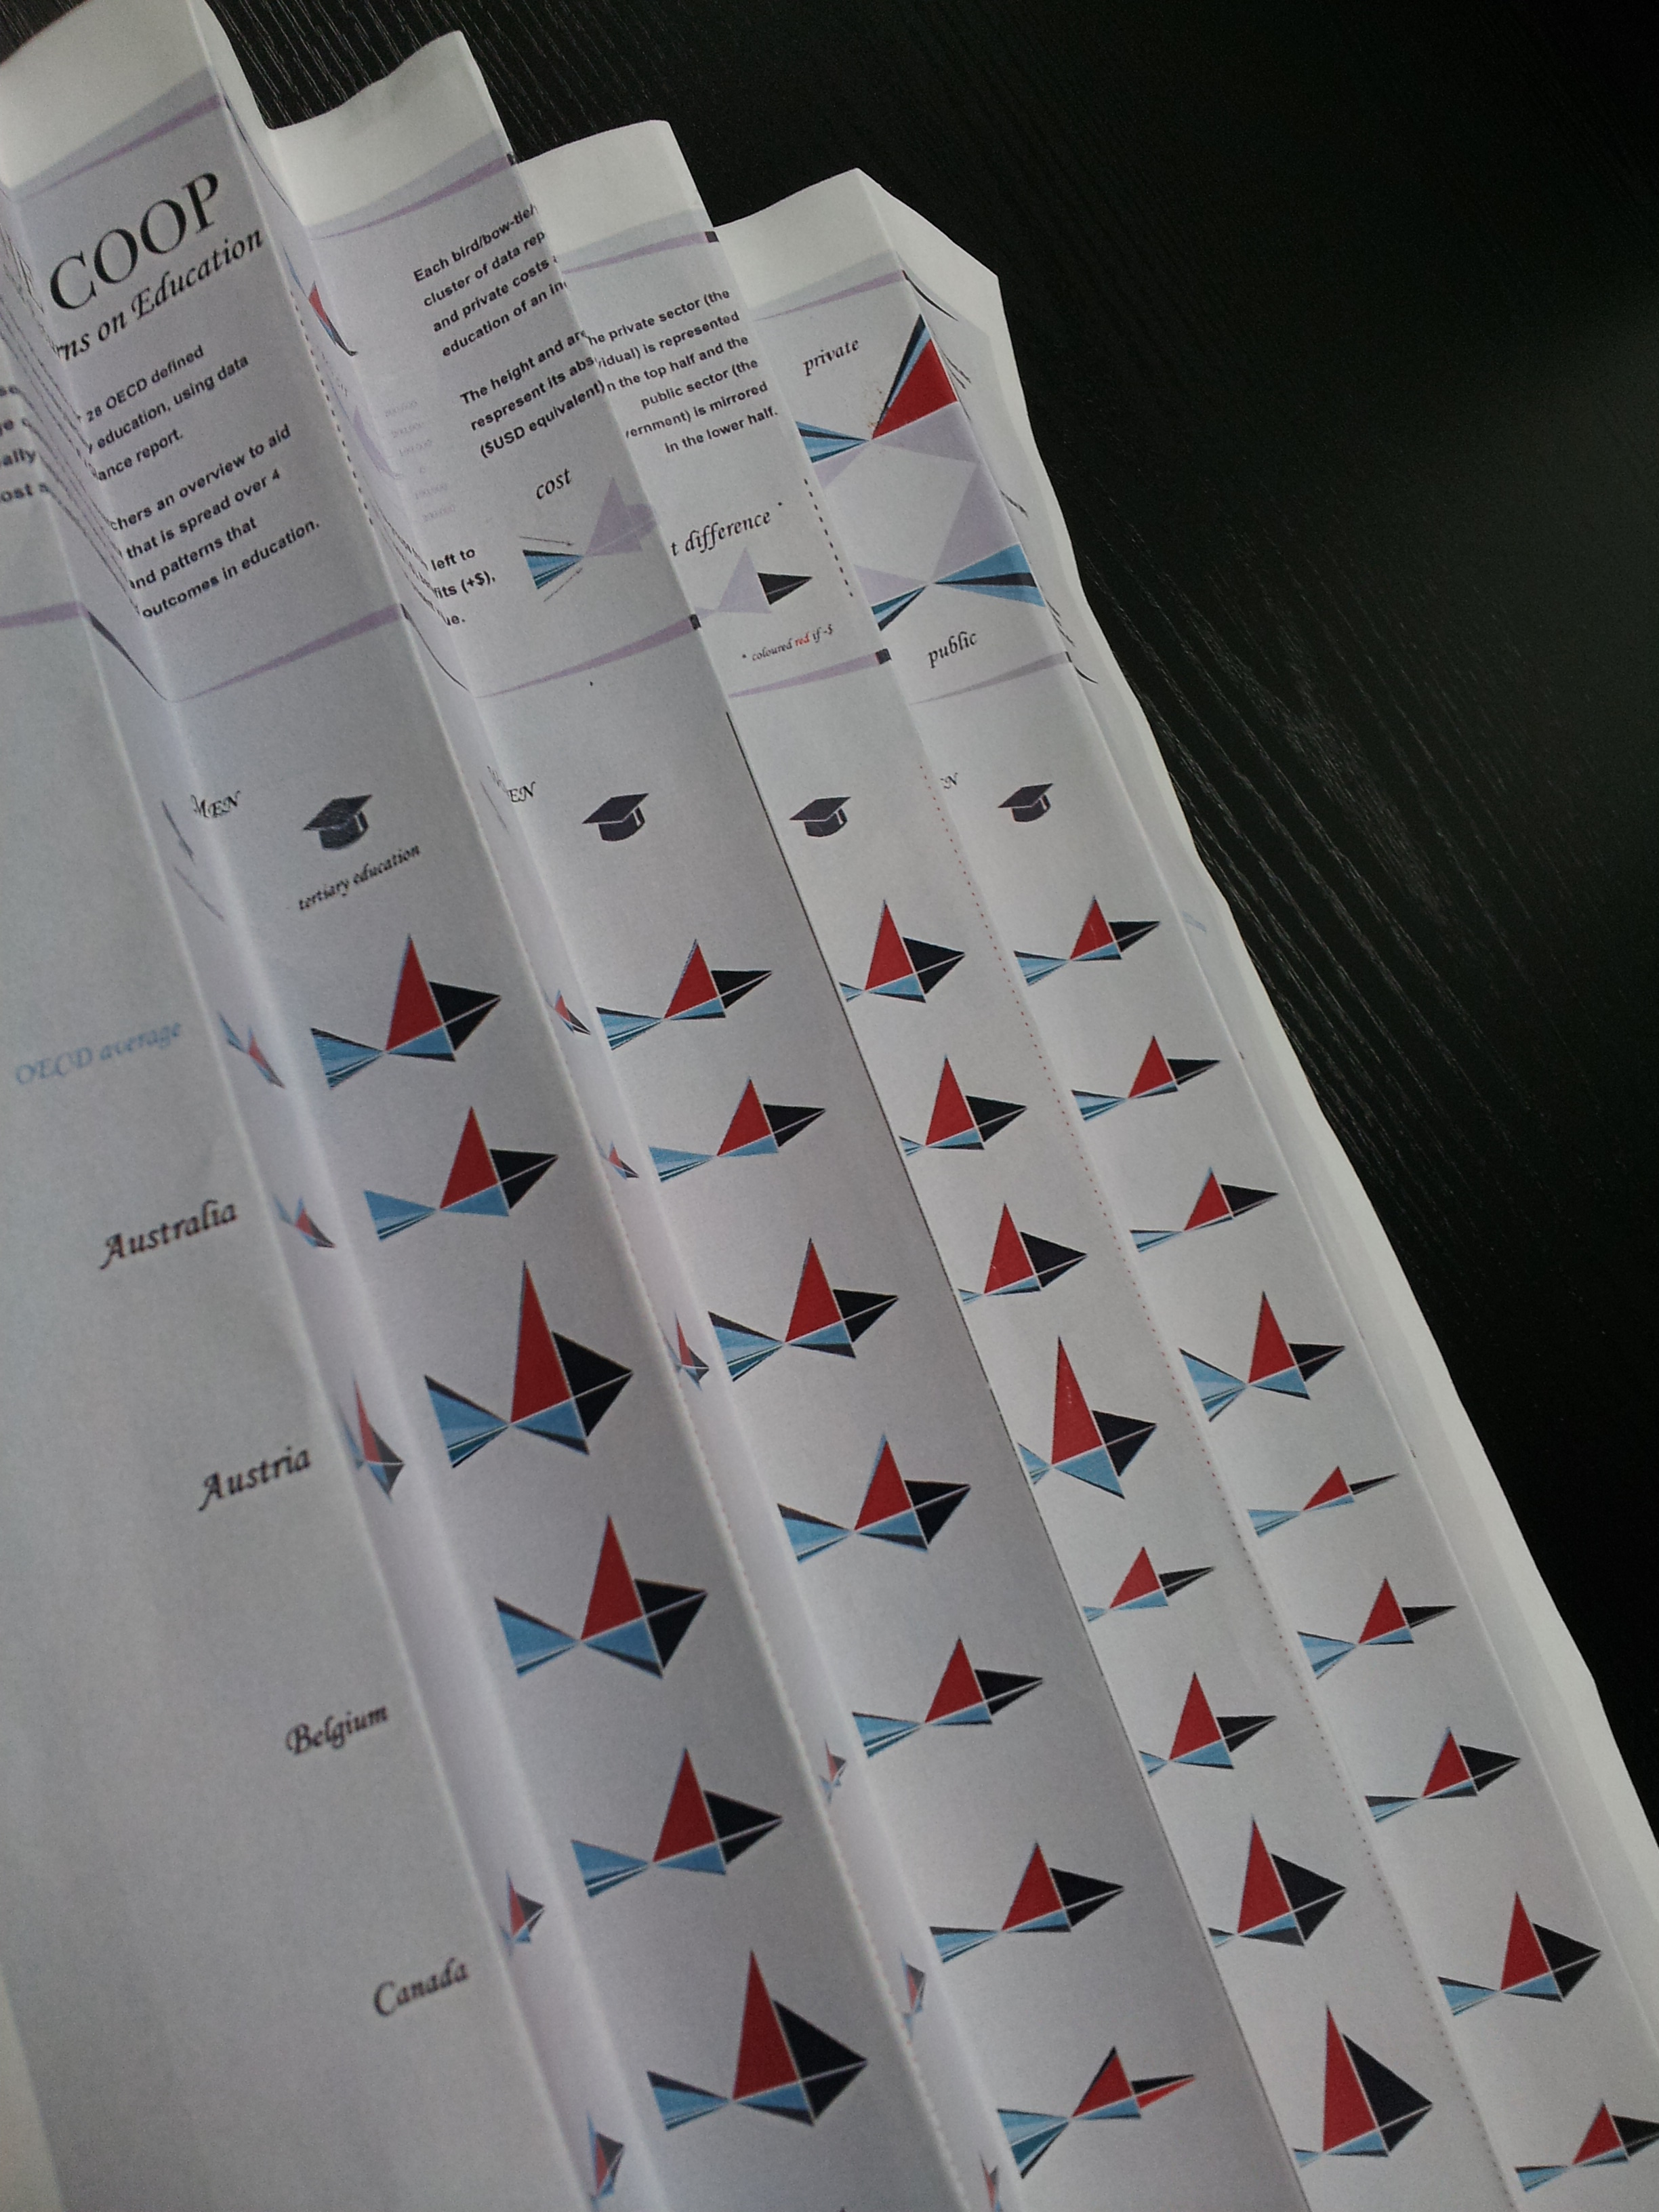
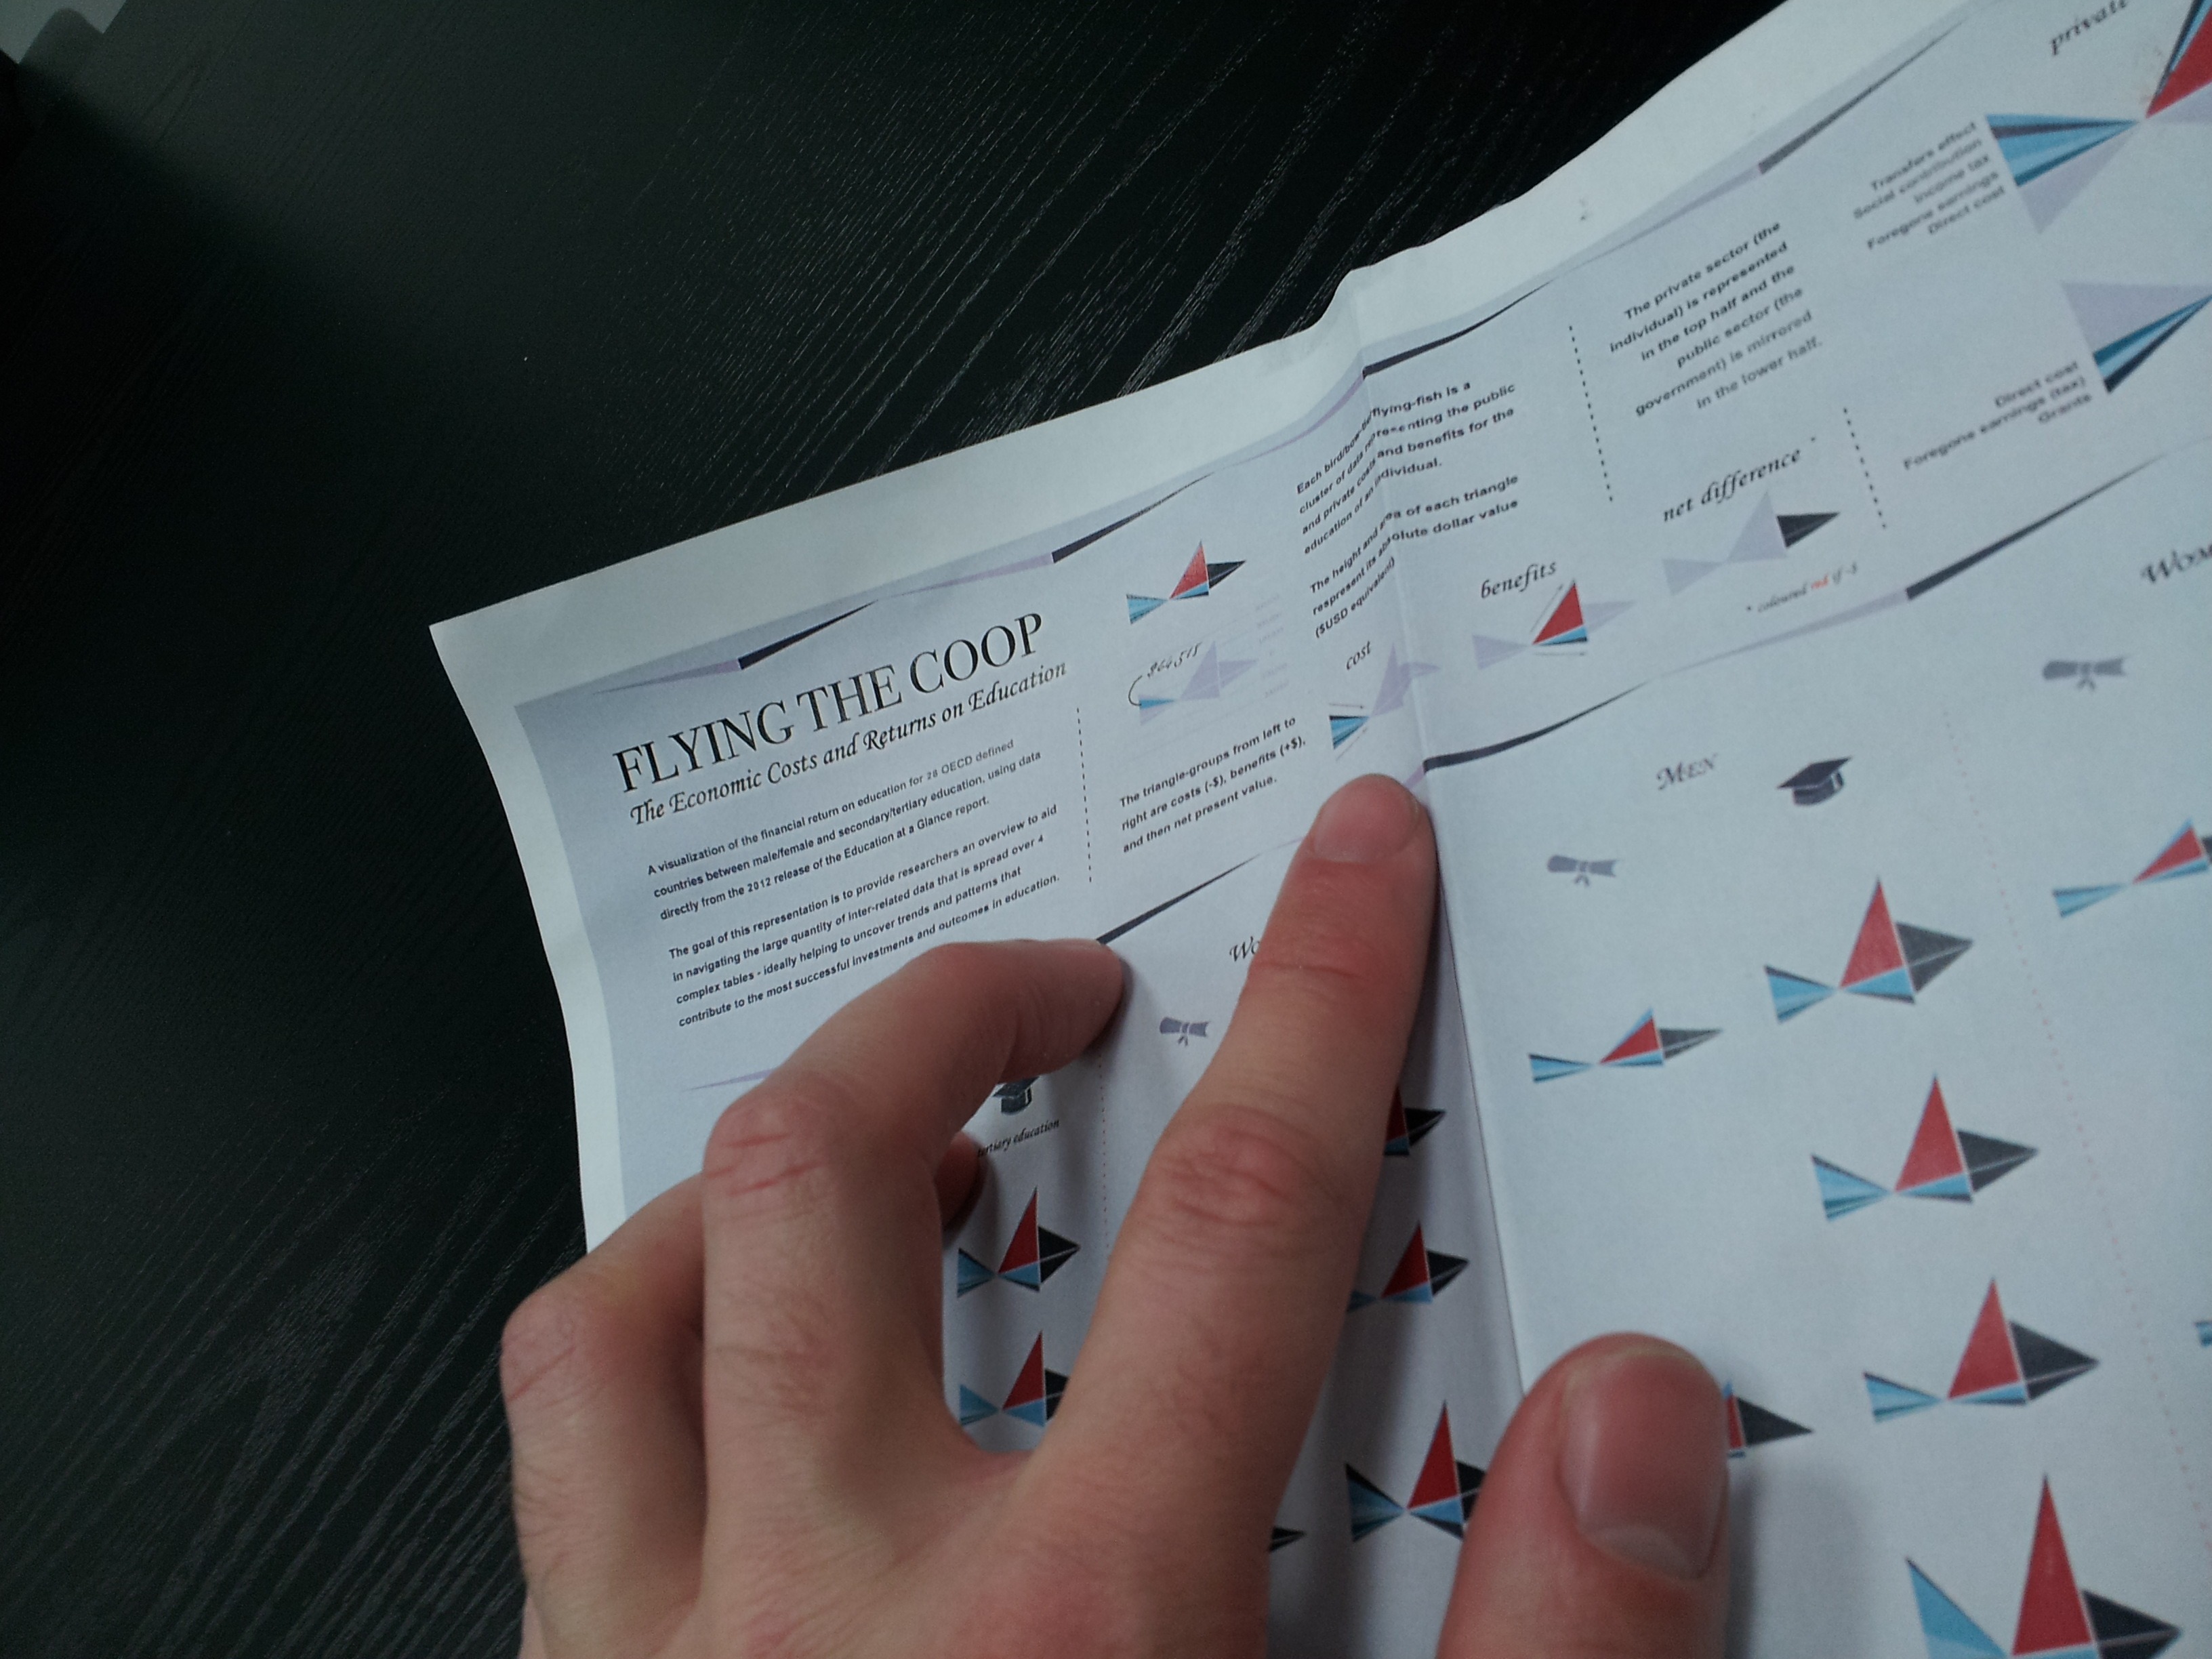
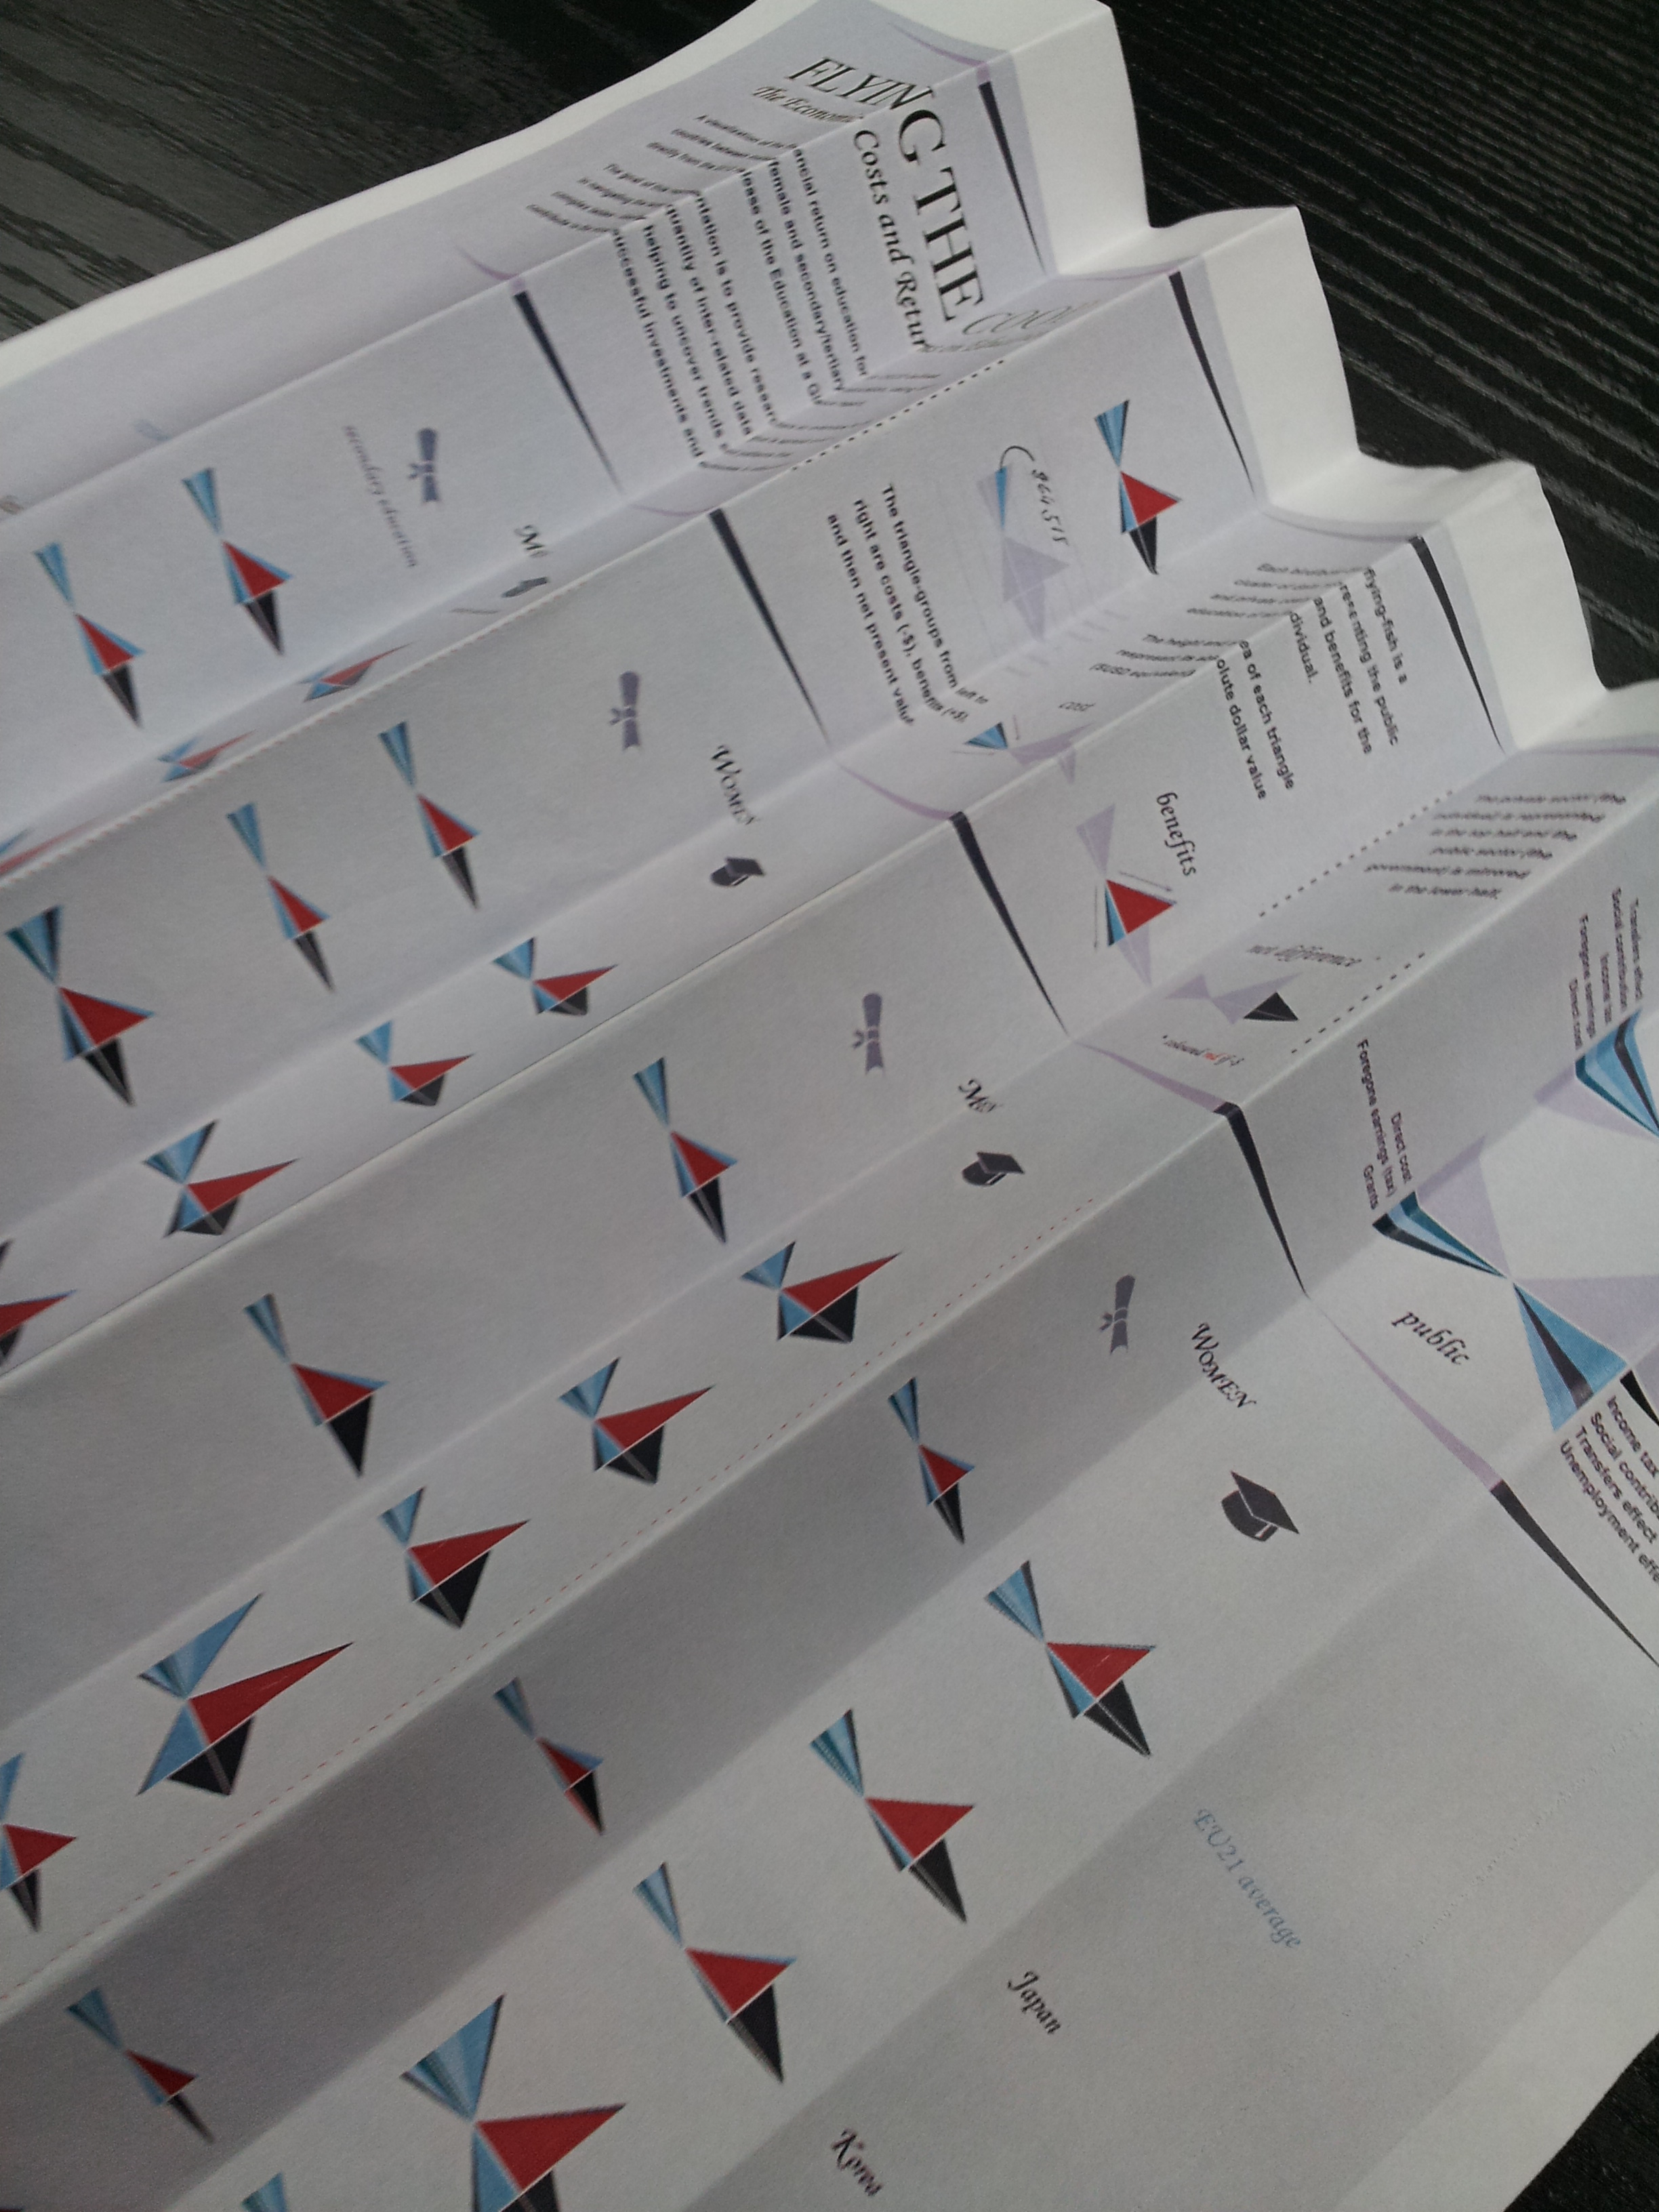
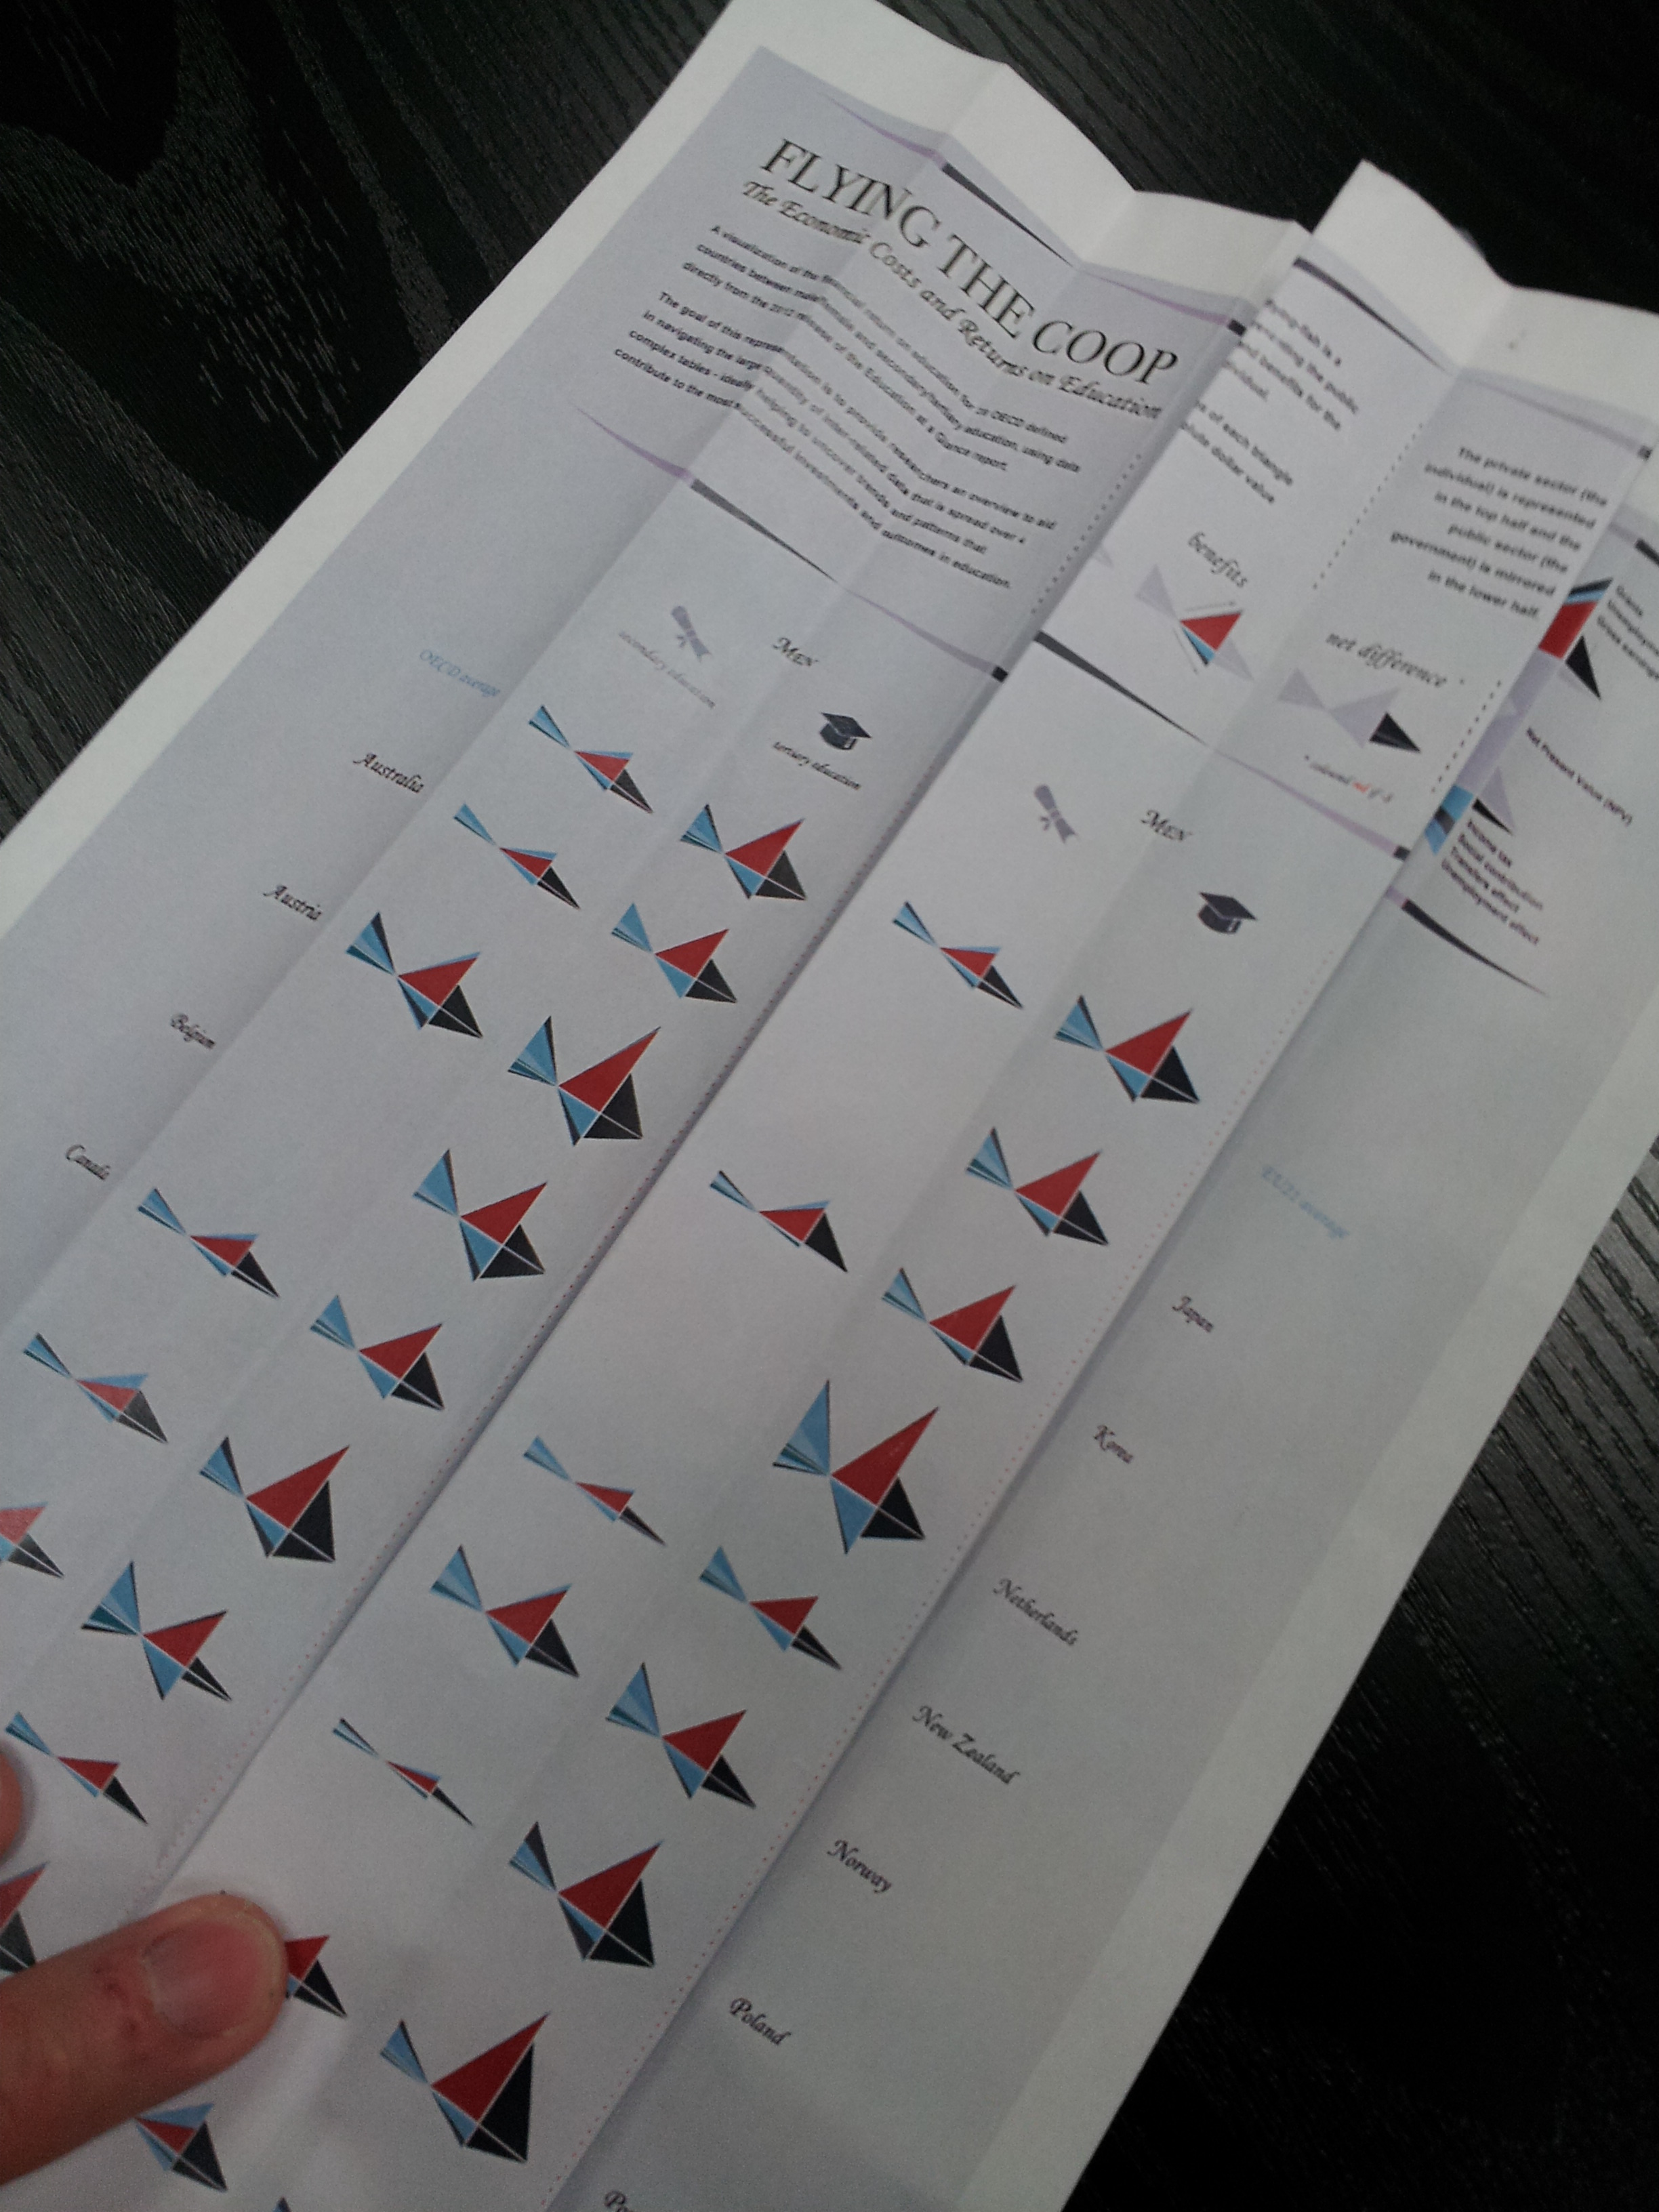
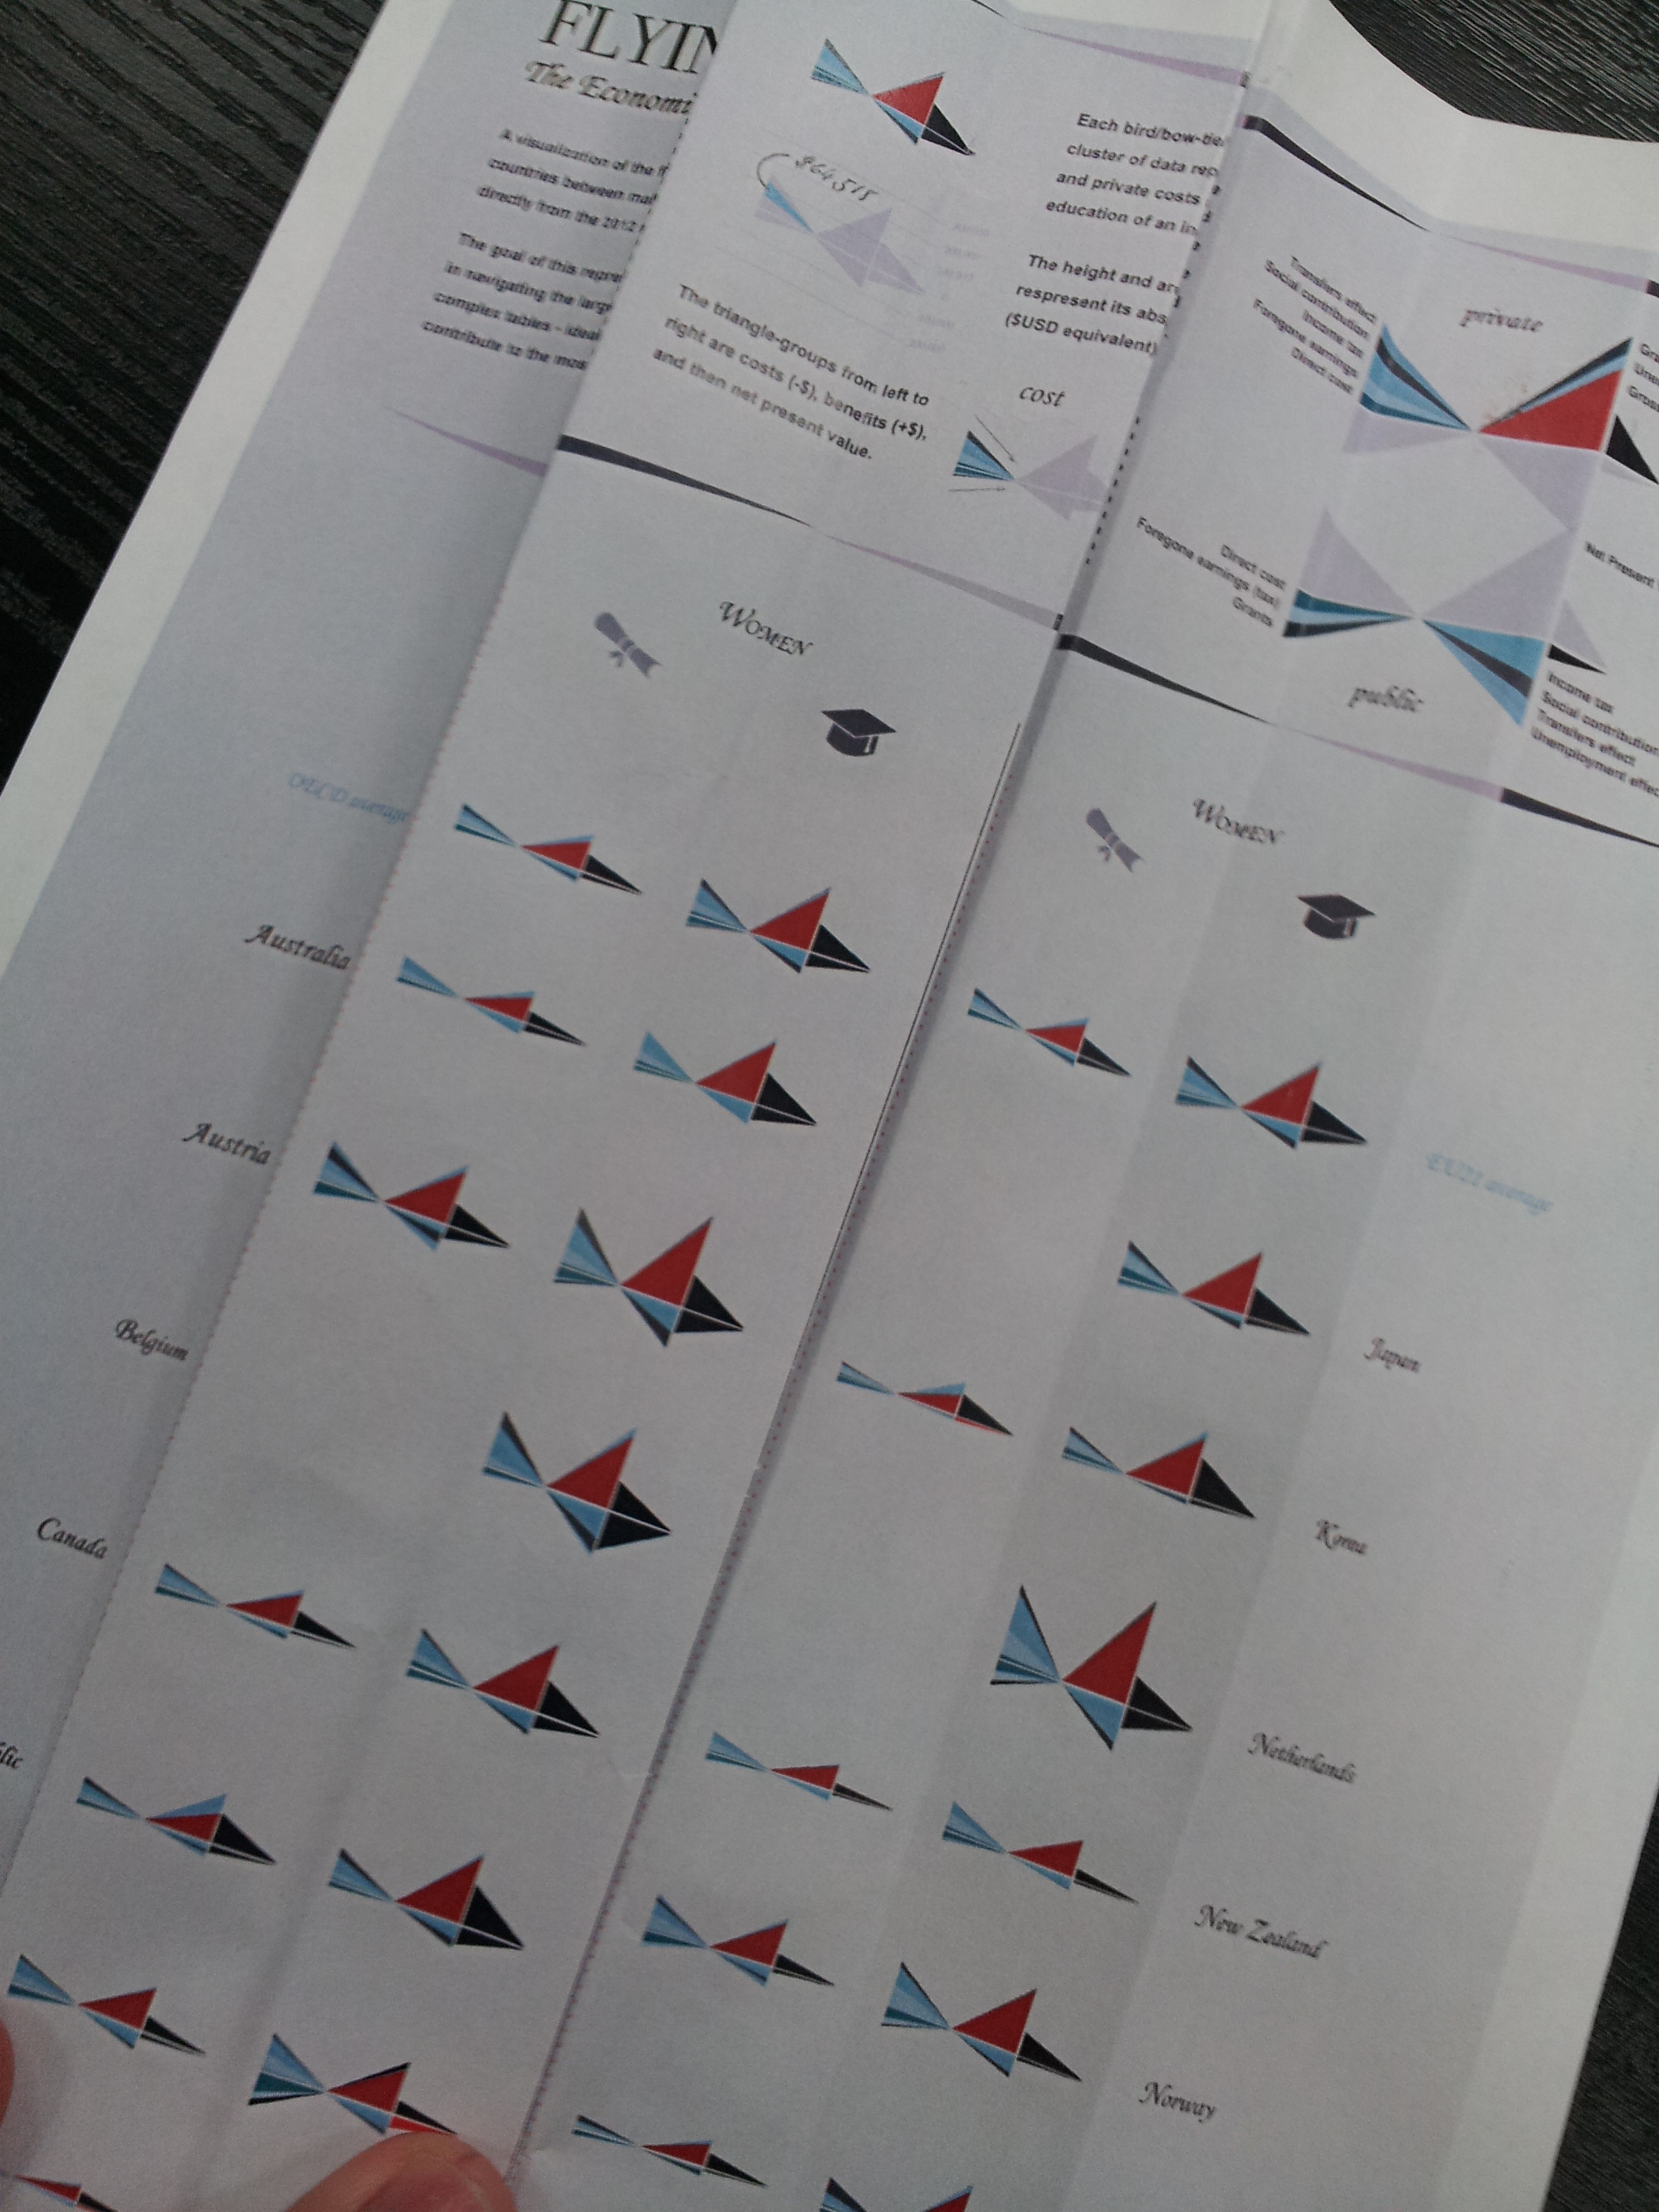
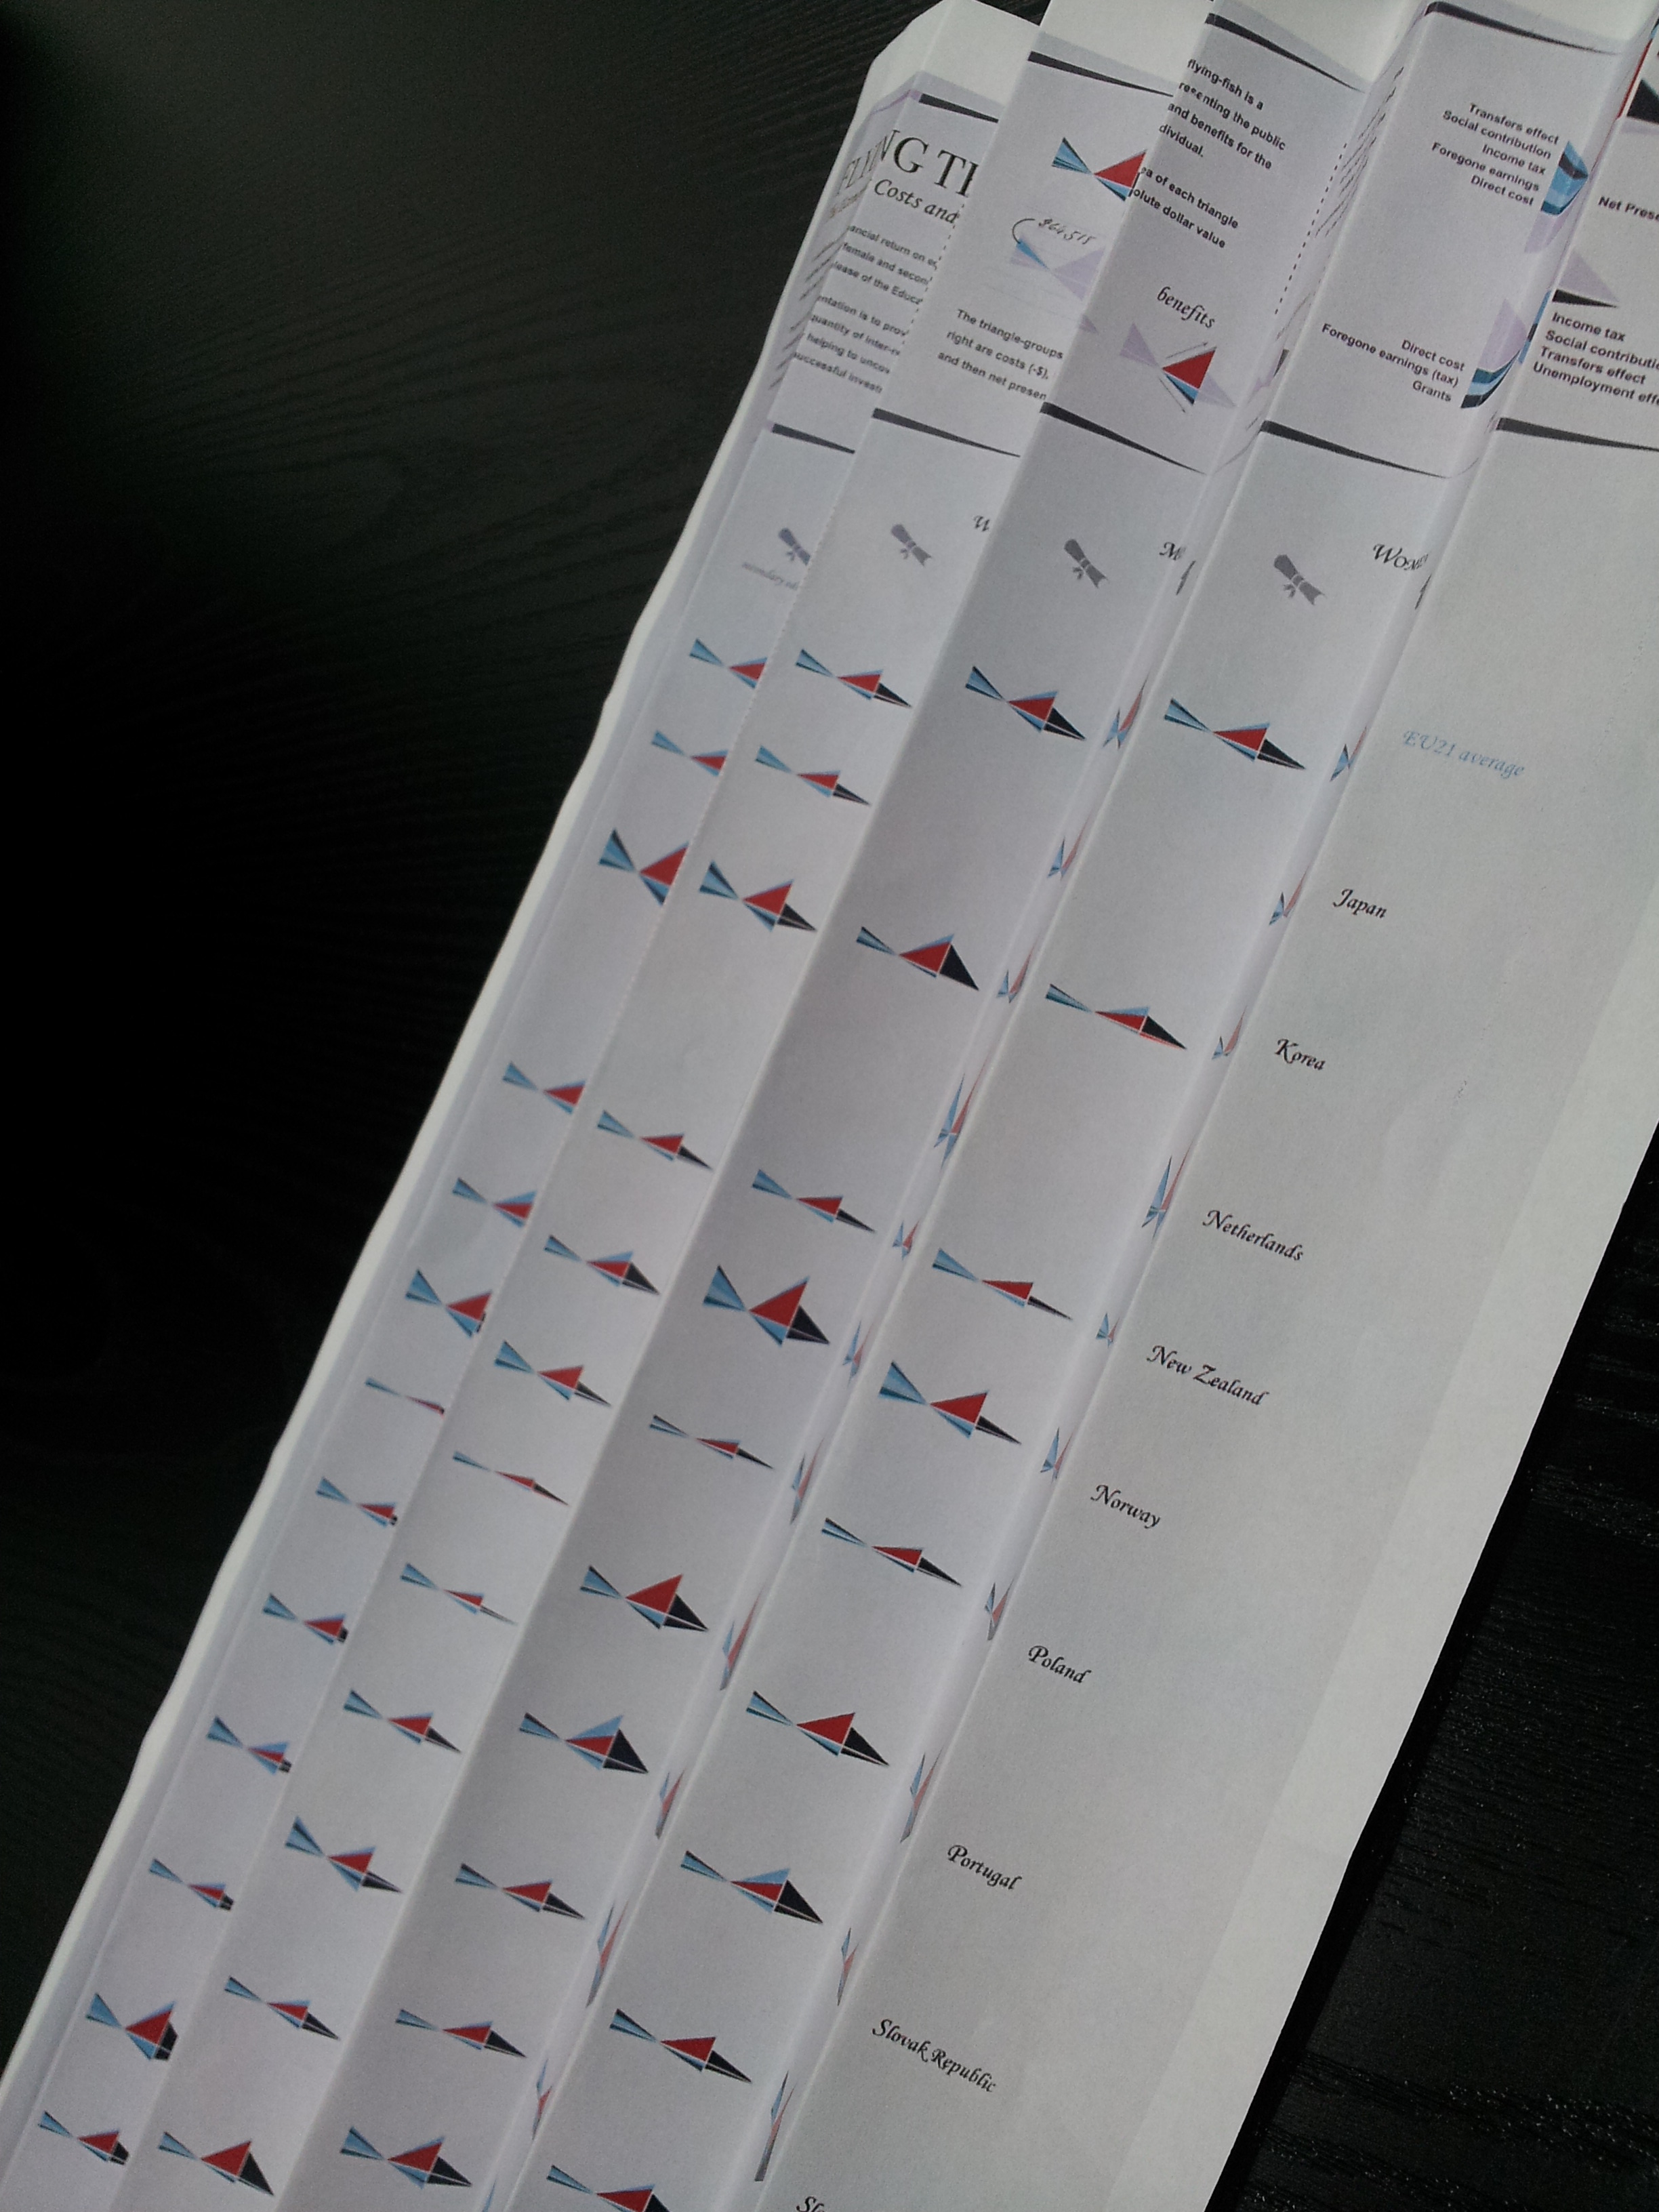
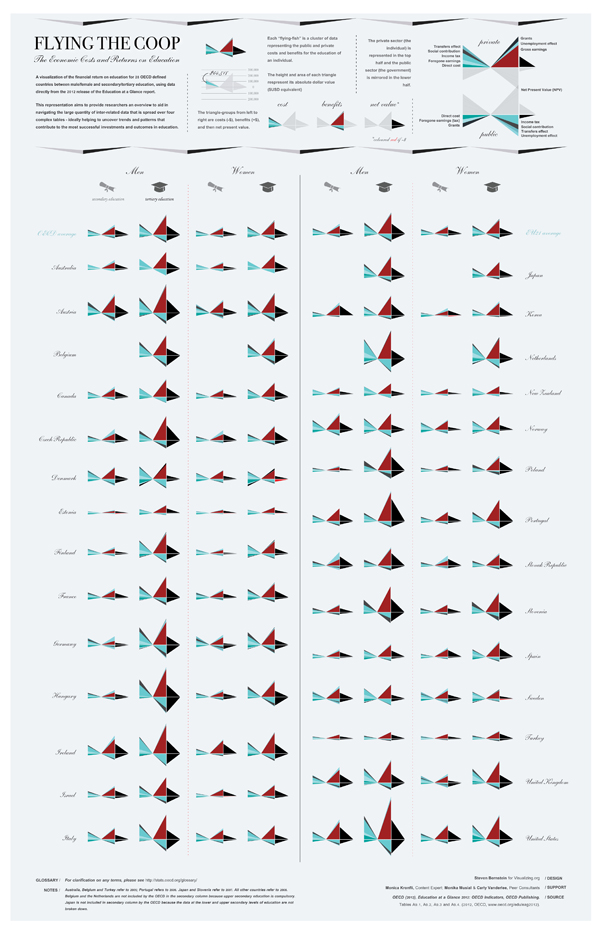
Flying the Coop: The Economic Costs and Returns on Education


Excel, Adobe Illustrator
This is a visualization I worked on on the side for a www.visualizing.com
I designed with an audience of researchers in mind who would be familiar with the content and could use this amalgamation of their data as an overview to help navigate the data and stimulate new discoveries of trends and patterns. Due to time constraints, I was resolved to go print instead of creating something interactive, which could have added clarity while navigating so much information. Fortunately though, by going in print, I discovered a way to filter the data through placement and folding which I was pretty excited about – which you can see in the series of pics below.